
Running three or more CDNs means better redundancy. It also means three dashboards, three log formats, and three places to look when something goes wrong. By the time you find the answer, the incident is already over.
That is not observability. That is archaeology.
The issue isn’t that CDN providers don’t generate data. They log every request, every cache decision, every origin response. The issue is that each provider holds its own piece of the picture, in its own format, behind its own interface. When something breaks across providers, you are not missing data. You are missing a single place to read it.
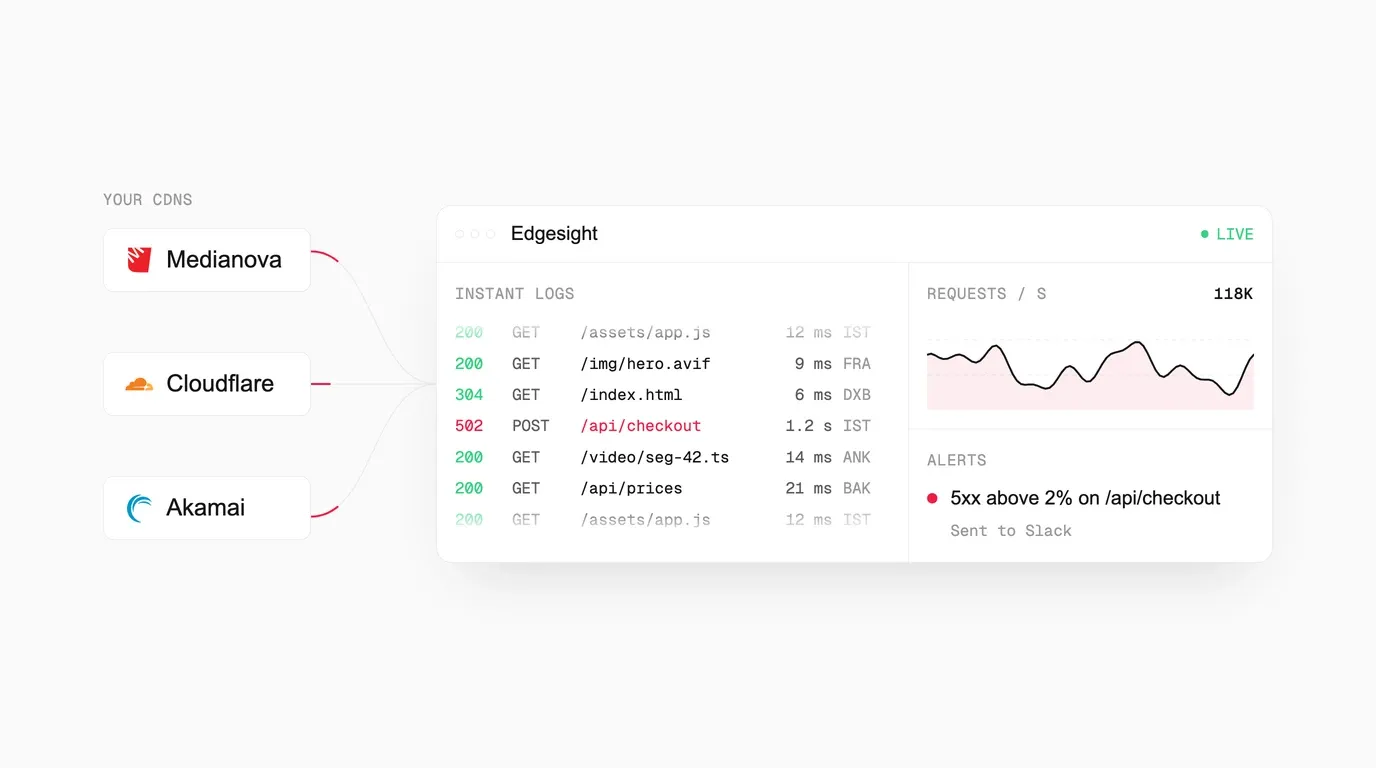
EdgeSight is Medianova’s CDN observability platform. It normalizes logs from Medianova, Cloudflare, and Akamai into one place, so you search once, read one set of dashboards, and get notified through one alert system, all from inside the Medianova control panel at cloud.medianova.com.
Here is what each part does.
What EdgeSight Covers
EdgeSight has four modules. Each one handles a different layer of CDN visibility.
- Instant Logs for real-time log search.
- Analytics for historical traffic dashboards.
- Alerts for threshold-based notifications.
- Logpush for continuous log delivery to your own infrastructure.
Search Any CDN Request in Seconds
You get a report of elevated error rates. You do not know which provider. You do not know which region. You open EdgeSight, search with filters and query syntax, and results come back within seconds.
Instant Logs gives you searchable access to request logs across Medianova, Cloudflare, and Akamai. One query runs across all selected sources at once, returning results in a single list. You can select one or more sources. All three share a normalized schema inside EdgeSight, with provider-specific fields preserved where they exist.
Inspect Any Request at the Field Level
Select any result and see its full details. See the cache decision, response code, and origin behavior for that specific request. You are not reading aggregated numbers. You are looking at exactly what happened to exactly that request.
Export When You Need It
Instant Logs supports CSV and NDJSON export. Pull the data into any external tool or reporting workflow you already use.
Read Your Traffic Patterns Over Time
Instant Logs shows you individual requests. Analytics shows you what your traffic has been doing, with up to 90 days of history depending on your plan.
You want to know how cache performance moved after a configuration change. Or whether error rates have been trending up since last Tuesday. Or how bot traffic compares this month against last. EdgeSight Analytics has pre-built dashboards for these questions. Traffic volume, cache performance, response status trends, and bot detection metrics are all visible without writing a custom query. In a live customer instance, cache hit rates tracked above 98 percent.
Dashboards support up to 90 days of history, depending on your plan. Longer retention is available on Enterprise plans by agreement.
Get Notified Before Your Users Do
The worst way to find out something is wrong is when a user tells you. The second worst is when you have to check a status page yourself.
EdgeSight Alerts monitors your CDN traffic continuously and fires when a configured condition is met. Error rate spikes. Cache hit rate drops. Slow origin responses. When the threshold is crossed, it sends a notification to Slack, email, or a webhook endpoint. You set the condition. You choose where it goes. EdgeSight handles the watching.
Send Your CDN Logs to Your Own Infrastructure
Not every team wants their log data living inside a SaaS dashboard. Some teams run a SIEM. Some run a data warehouse. Some have a custom analytics pipeline that already handles everything else. Logpush is for those teams.
Logpush delivers Medianova CDN log data continuously to an external destination you control. Supported destinations: S3-compatible storage, Stook (Medianova’s object storage), HTTP endpoint, and Elasticsearch. Feed your SIEM via an HTTP endpoint or Elasticsearch, or route logs into any data warehouse or analytics pipeline your team already runs.
How to Get Started
EdgeSight lives inside the Medianova control panel at cloud.medianova.com. You do not need a separate account or a new tool to install. Sign up, connect one or more CDN sources (Medianova, Cloudflare, or Akamai), and all four modules are ready to use. Instant Logs starts indexing request data immediately. Analytics begins building your traffic history. Alerts can be configured in minutes. If you run Medianova CDN and want logs in your own infrastructure, Logpush is ready to configure from the same panel.
A 15-day free trial is available. No credit card required.
Start from any module page: Instant Logs, Analytics, Alerts, or Logpush.
Frequently Asked Questions
Which CDN providers does EdgeSight support?
EdgeSight currently supports Medianova, Cloudflare, and Akamai as CDN sources.
What is the difference between Instant Logs and Analytics?
Instant Logs is for real-time search and request-level investigation. Analytics is for historical dashboards and trend analysis over longer time ranges. They answer different questions. Instant Logs tells you what happened to a specific request. Analytics tells you how your traffic has been behaving over time.
What export formats does Instant Logs support?
CSV and NDJSON.
Where do alerts get delivered?
Alerts route to Slack, email, or a webhook endpoint. You configure the destination when setting up the alert.
What is Logpush and when do I need it?
Logpush delivers your Medianova CDN logs continuously to infrastructure you control: S3-compatible storage, Stook, an HTTP endpoint, or Elasticsearch. It does not push Cloudflare or Akamai logs. If your team needs Medianova CDN log data in an external system rather than the EdgeSight interface, Logpush is the right option.
Do I need to use Medianova as my CDN to access EdgeSight?
No. An account on cloud.medianova.com is all you need to connect Cloudflare or Akamai sources. You don’t need a Medianova CDN account. Note that Logpush only delivers Medianova CDN logs.
Is there a free trial?
Yes. A 15-day free trial is available with no credit card required. Start from any module page in the control panel: Instant Logs, Analytics, Alerts, or Logpush.
One Place for Everything Your CDN Logs
Multi-CDN is the right architecture for most teams running traffic at scale. The visibility problem that comes with it does not have to be. EdgeSight gives you one place to search logs, read dashboards, set alerts, and push data to your own stack, across every provider you run.
Start a free EdgeSight trial or talk to the Medianova team to walk through your setup.